
EasyMap
Drop a pin anywhere on Earth. EasyMap pulls live urban data and renders publication-grade analysis diagrams.
No GIS software, no manual tracing, no data wrangling. Pick a location and a radius, choose the analyses you need, and EasyMap generates a coordinated set of clean, editorial diagrams.
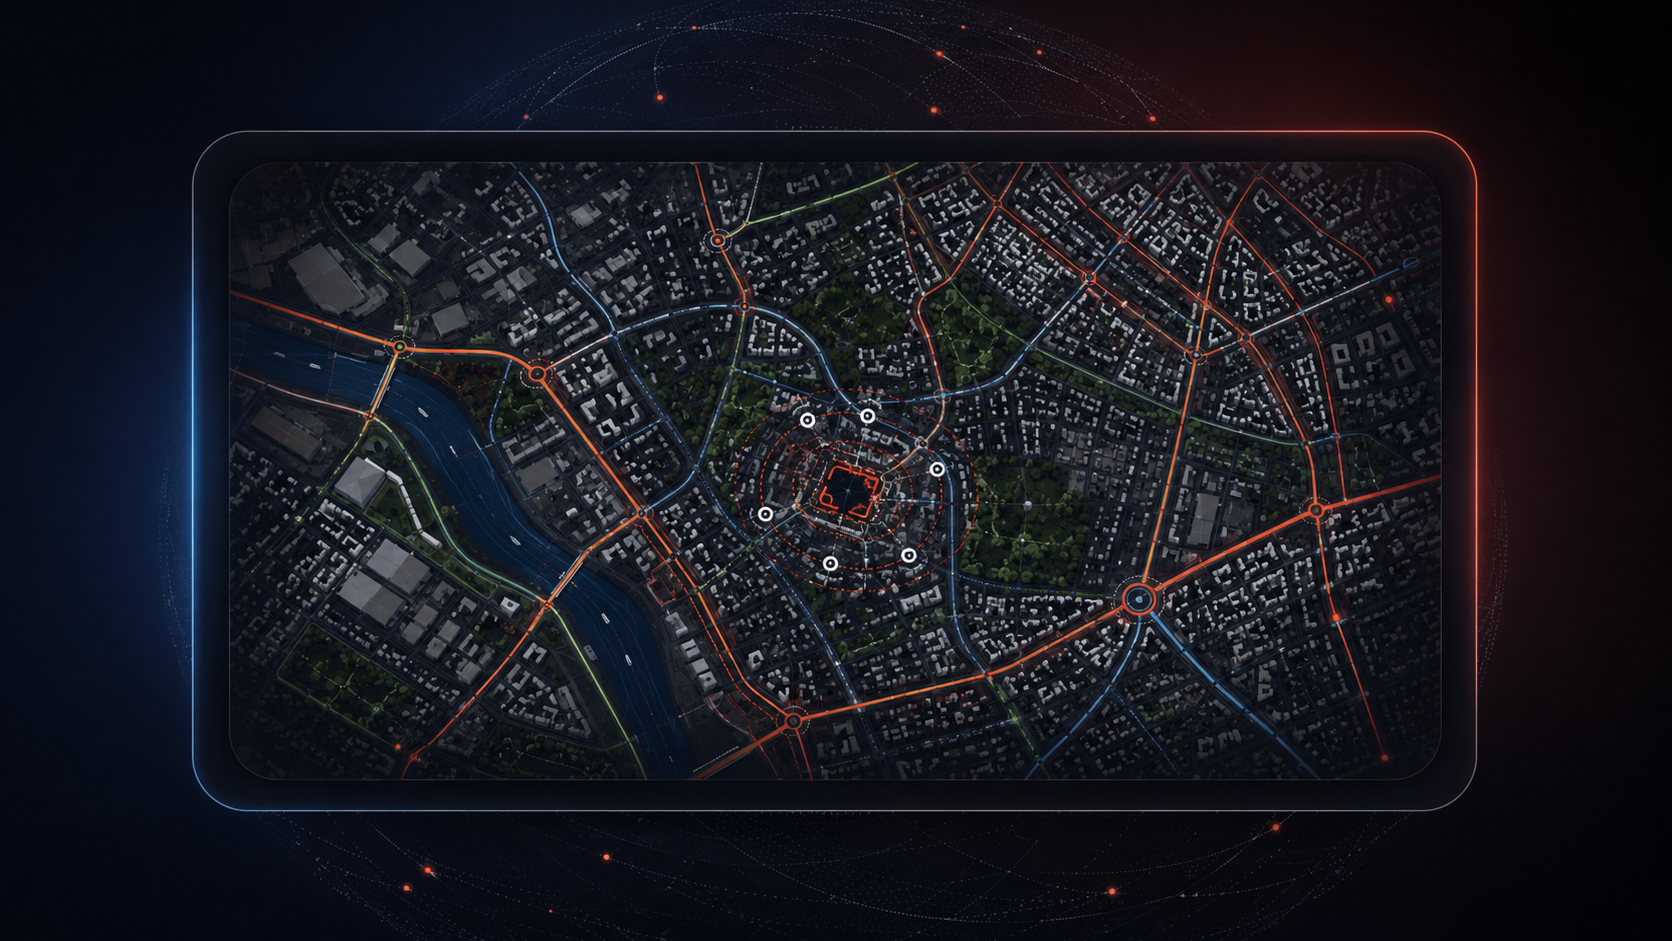
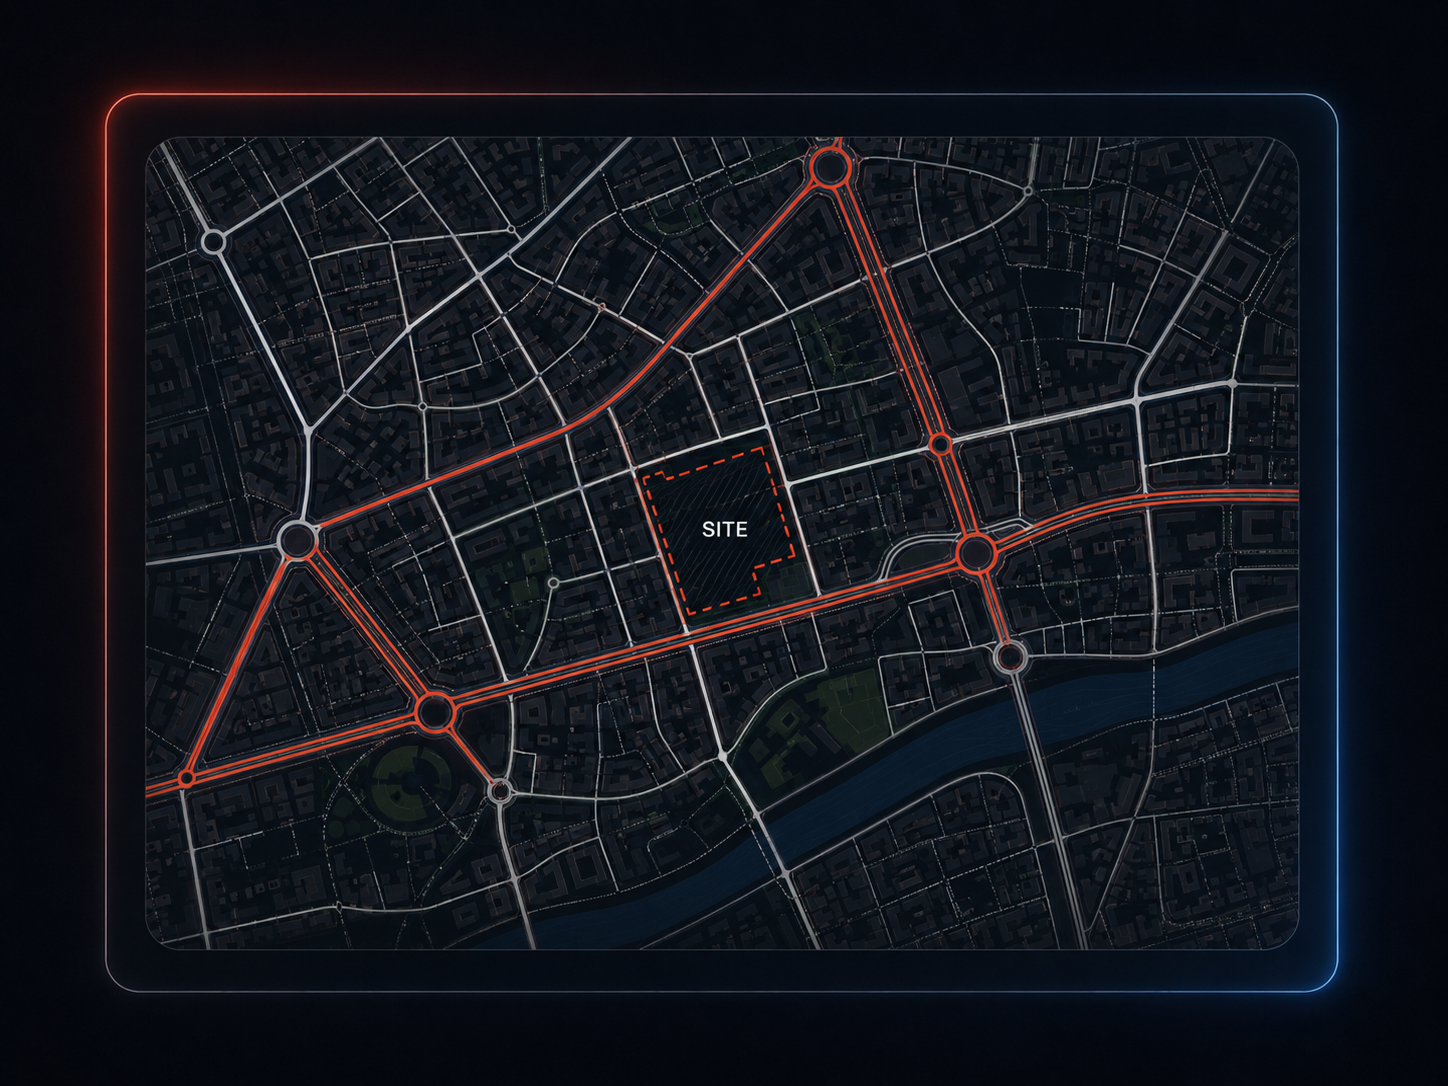
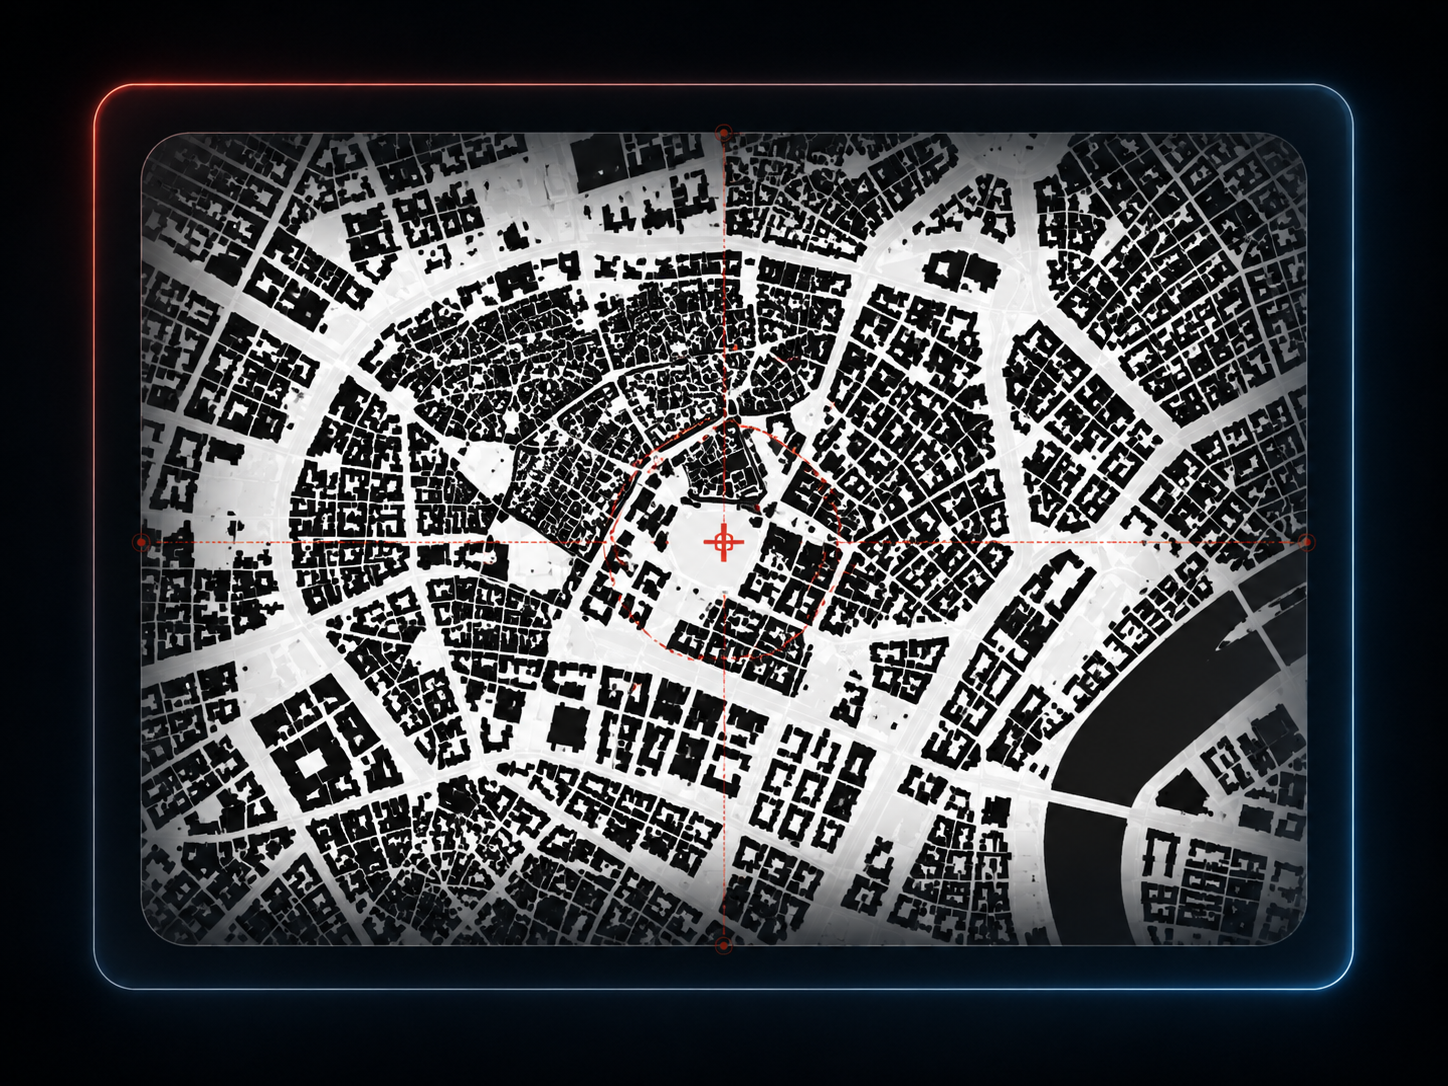
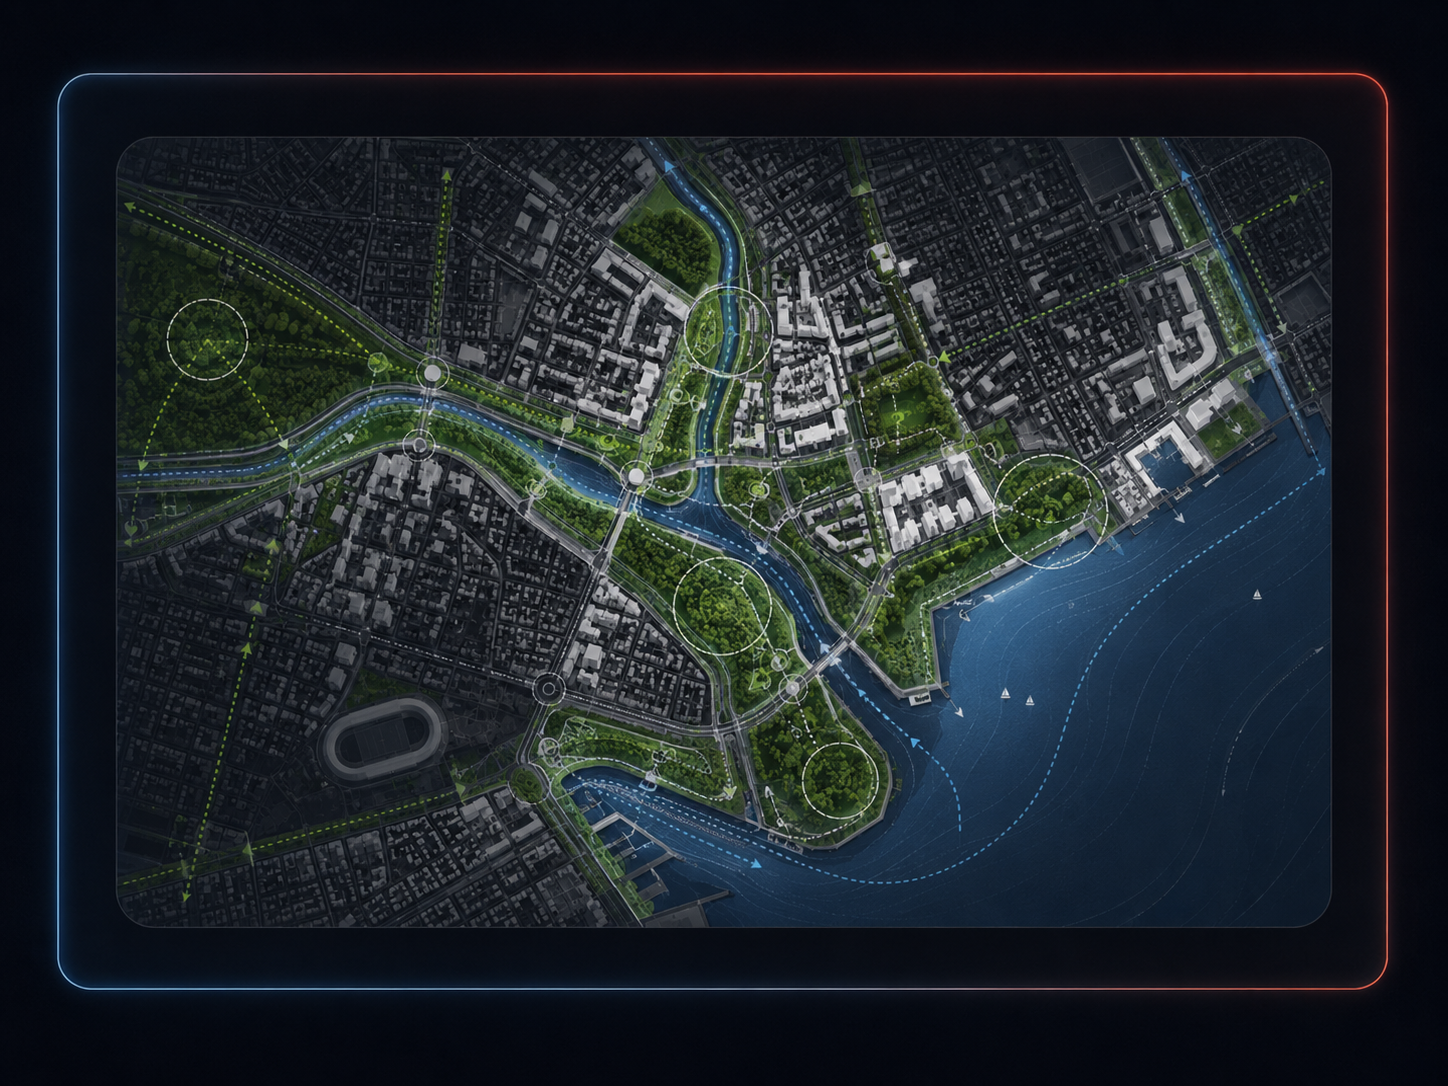
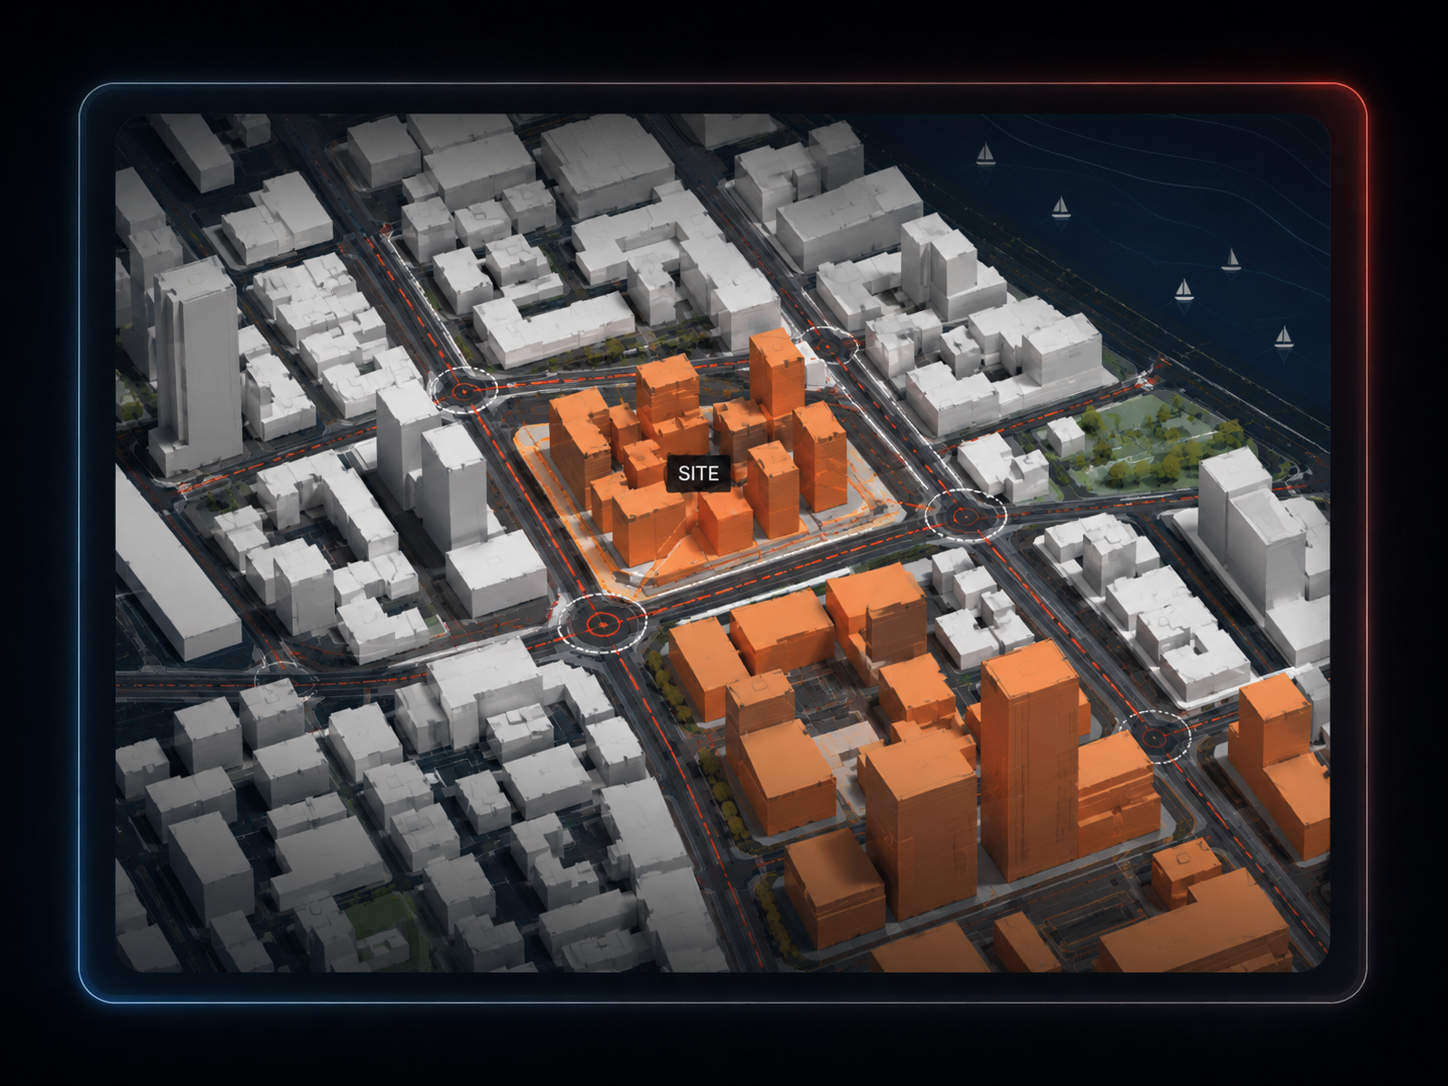

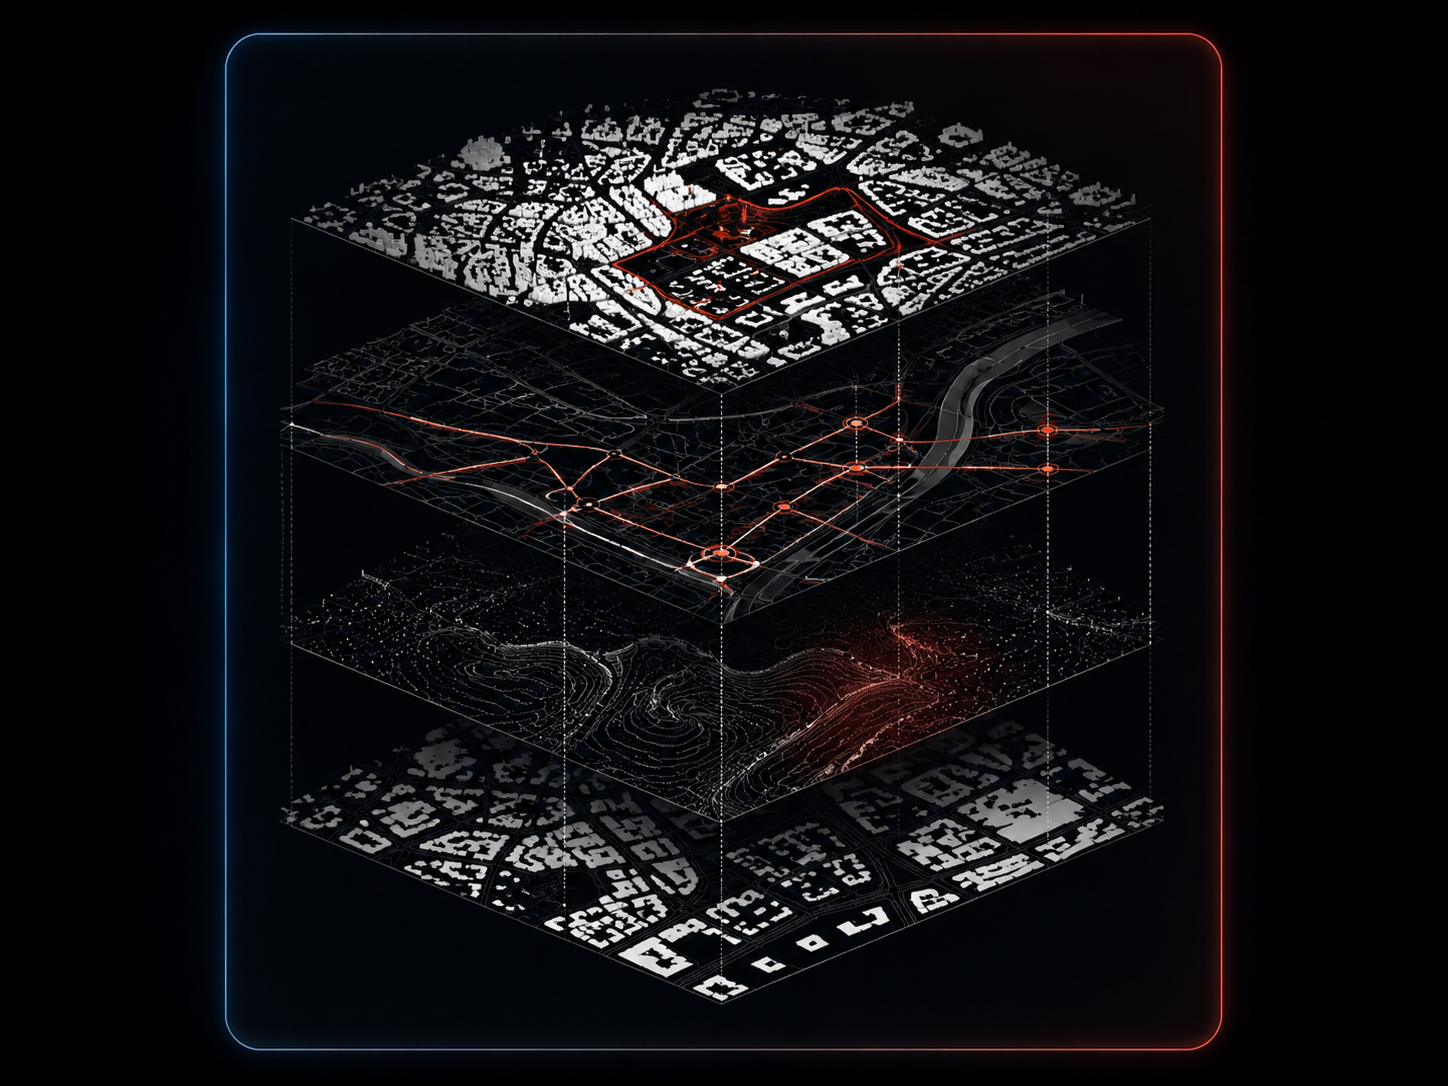
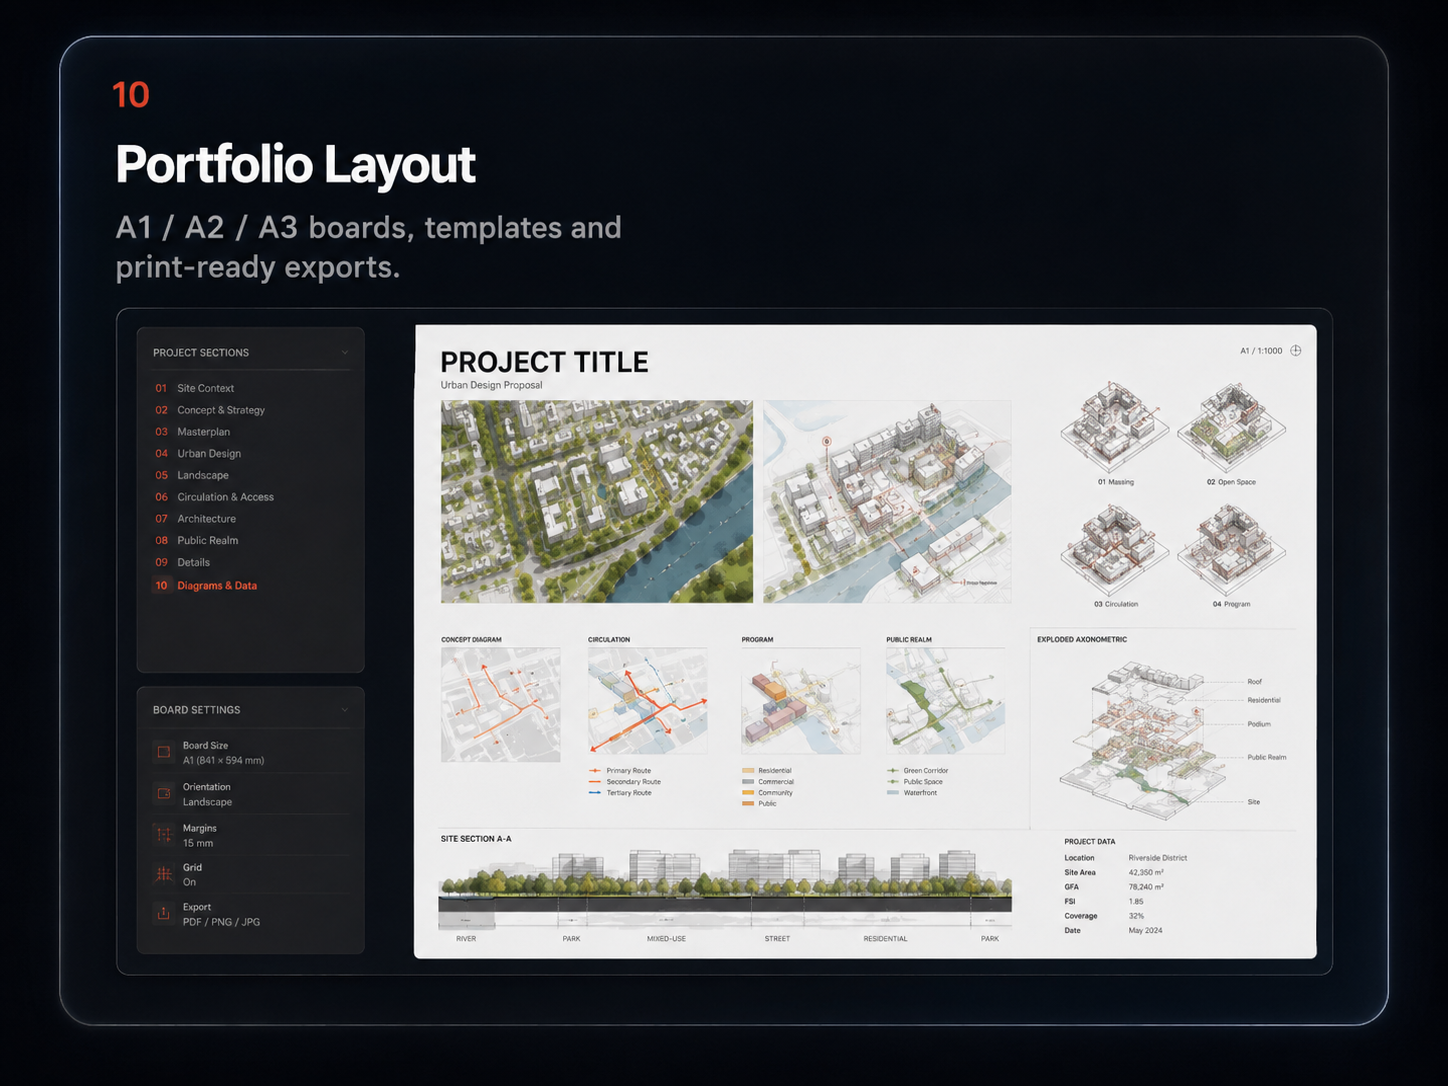
EasyMap Max connects the diagrams architecture students actually submit: analysis, strategy, plan/AXO, flow, bubble, parti, plan render and portfolio layout.
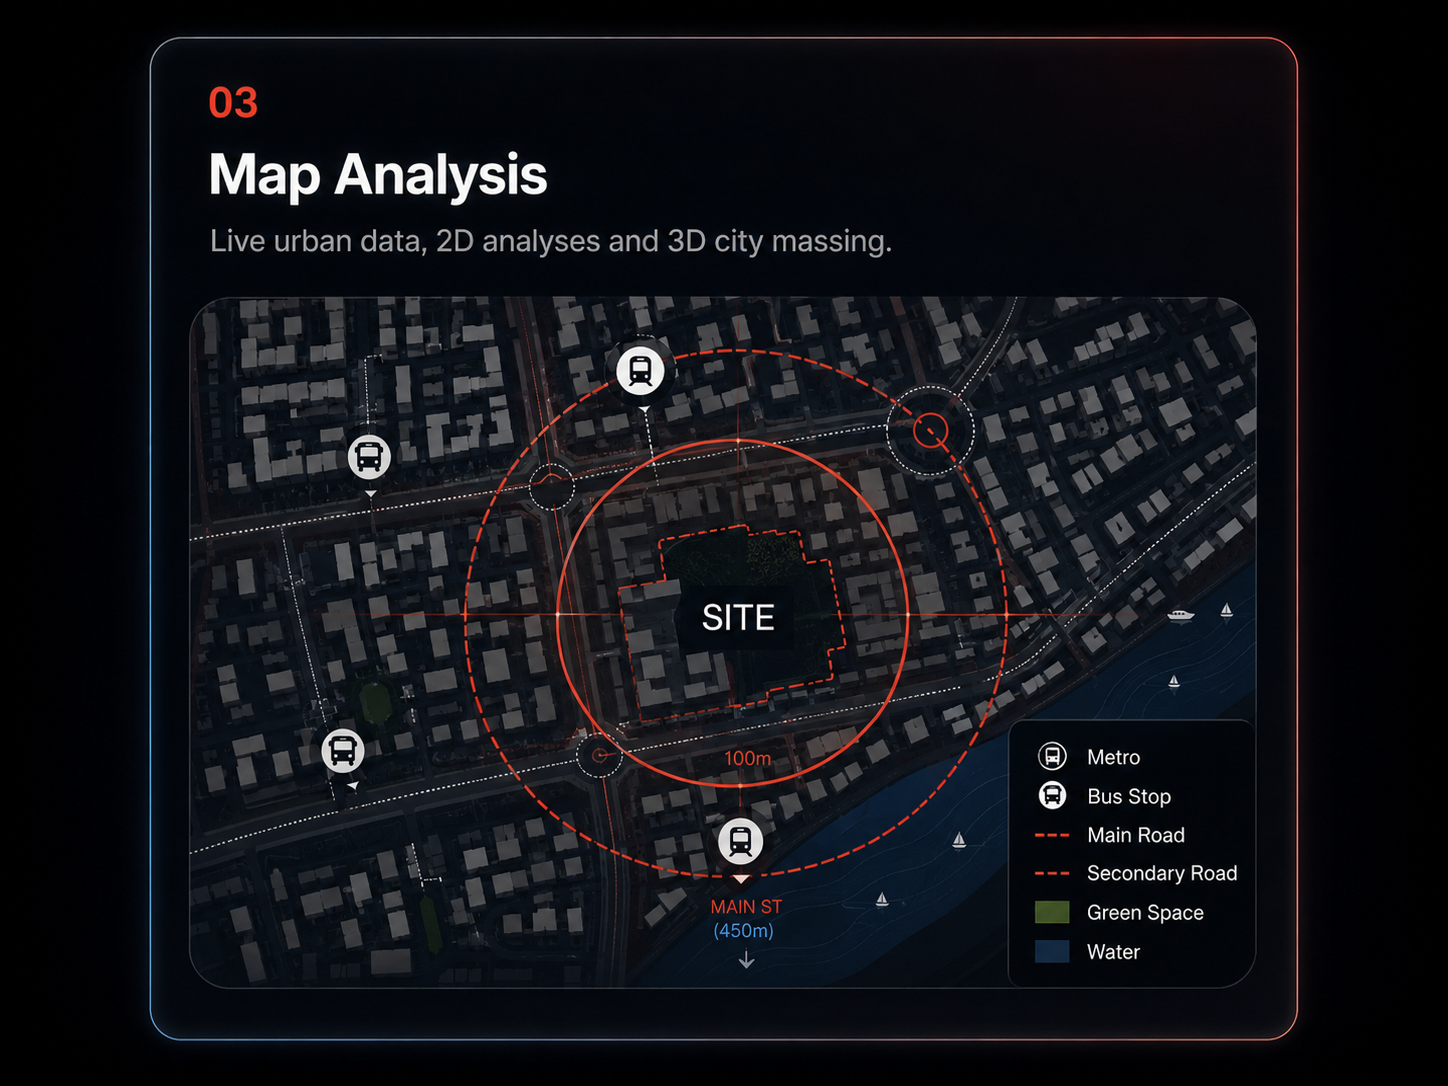
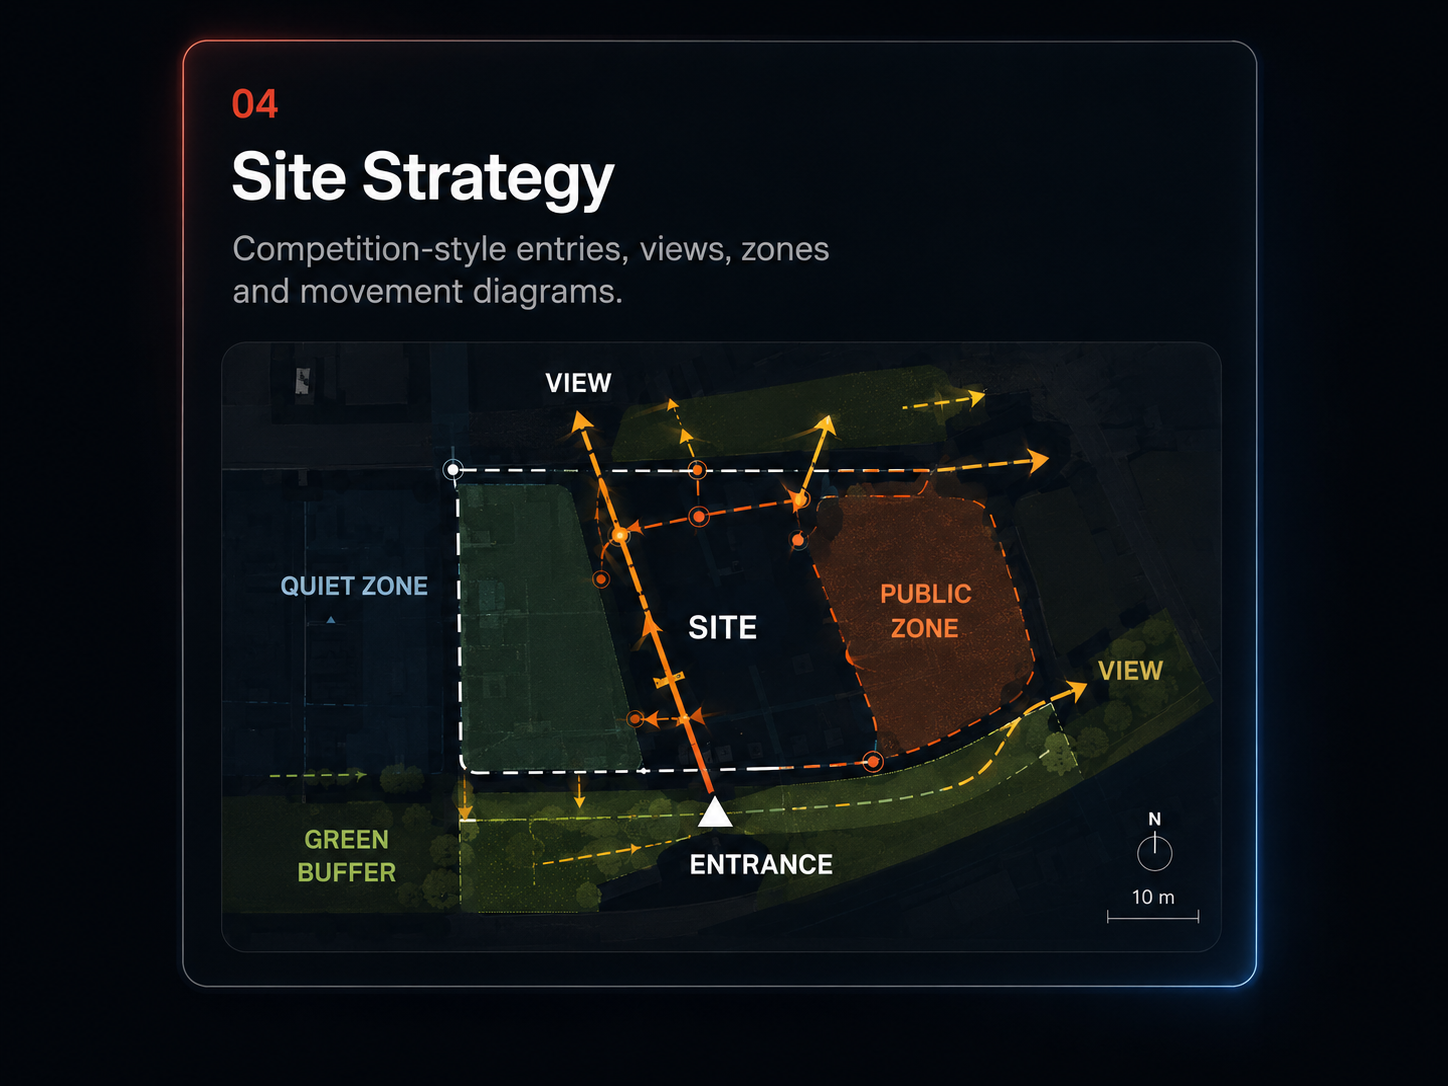
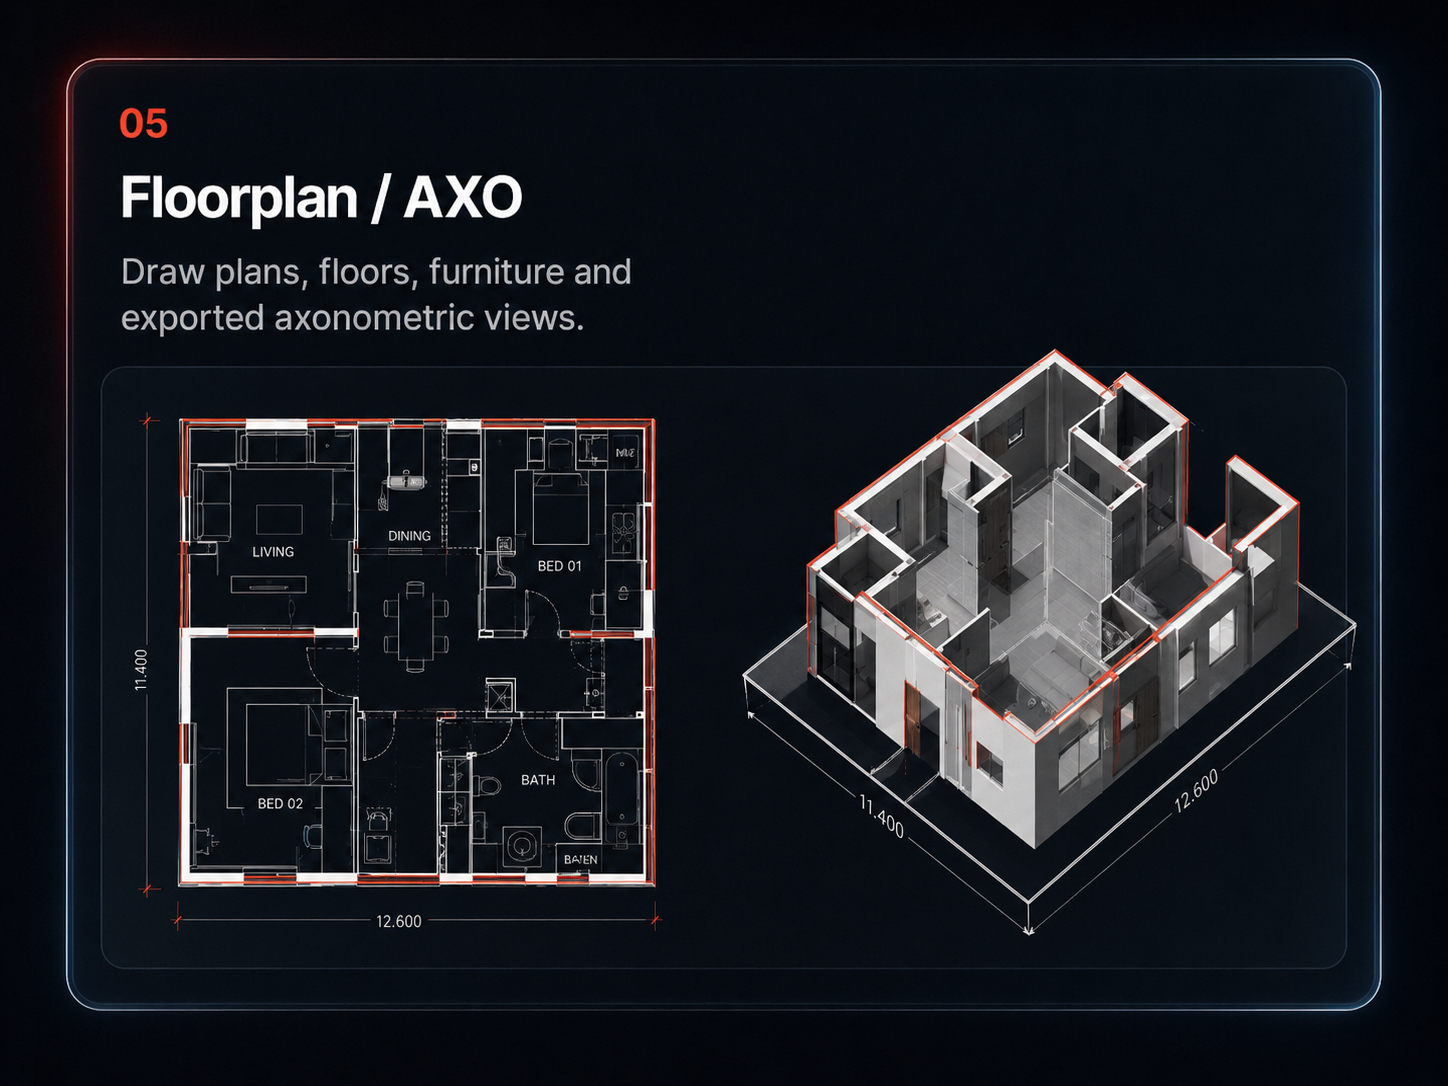
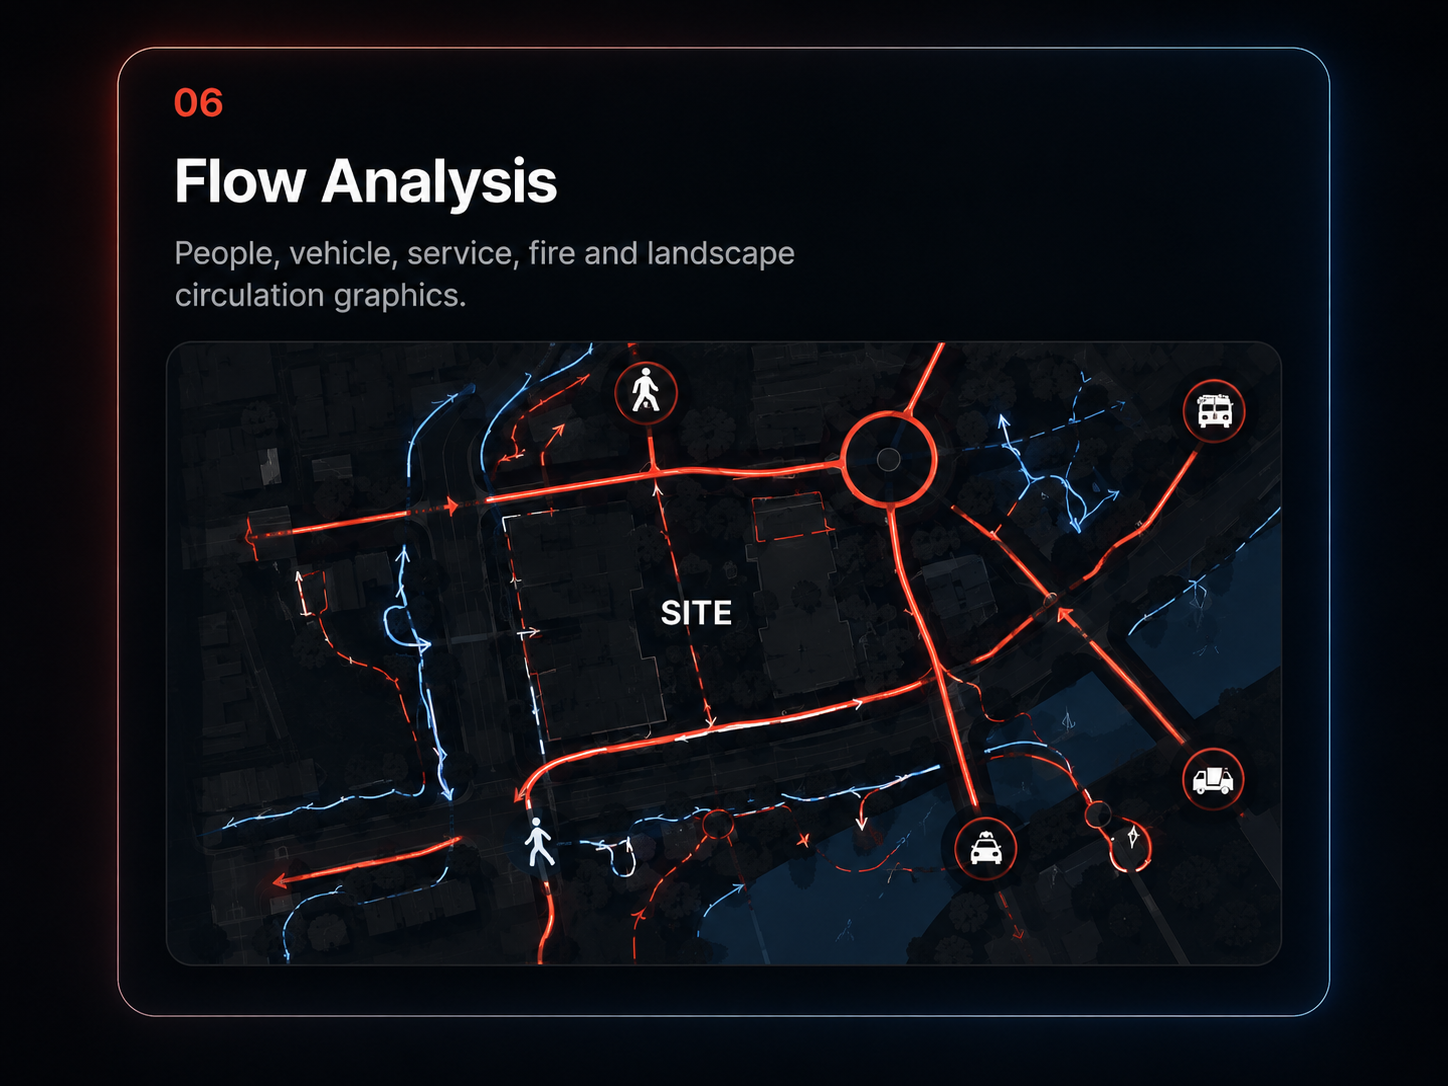

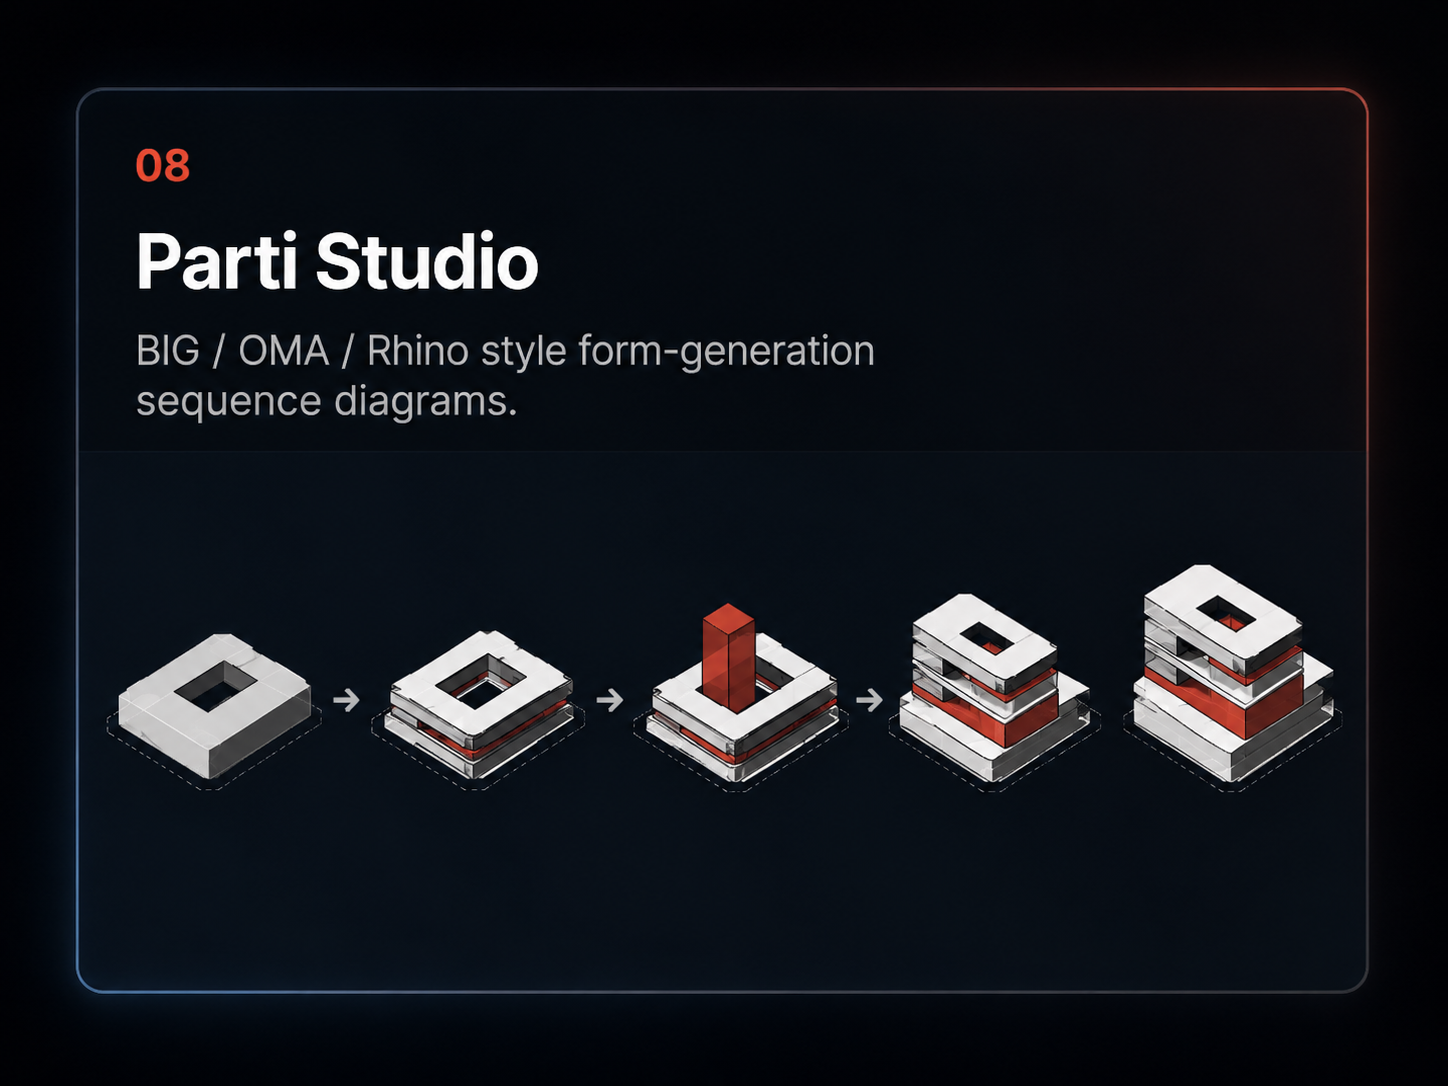
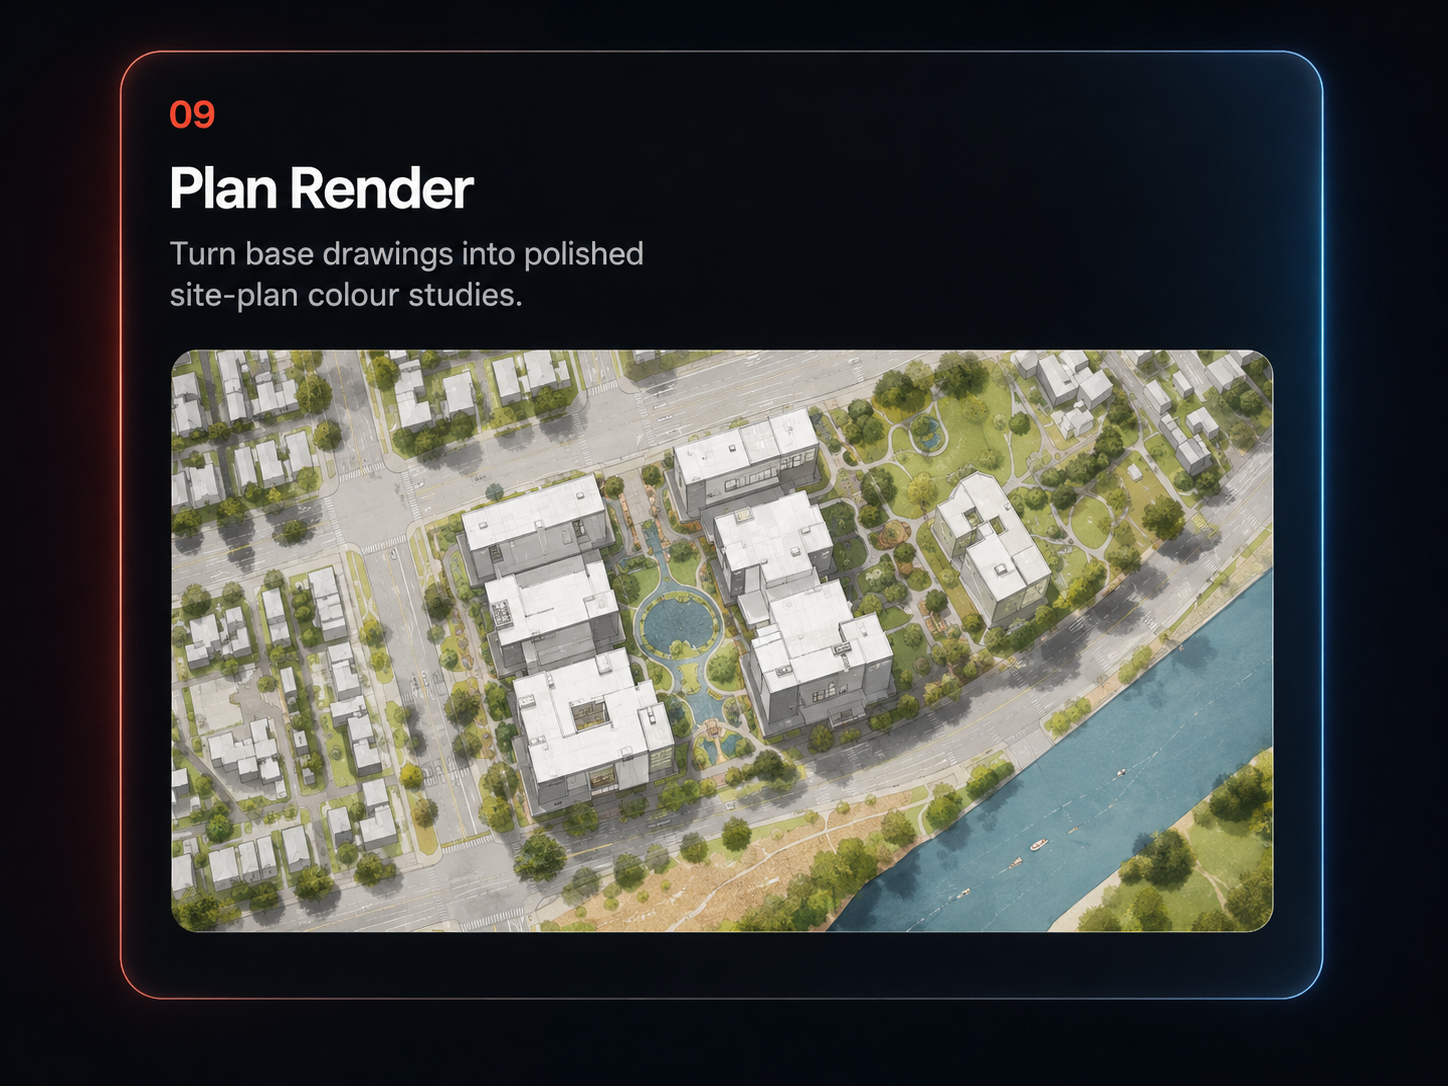
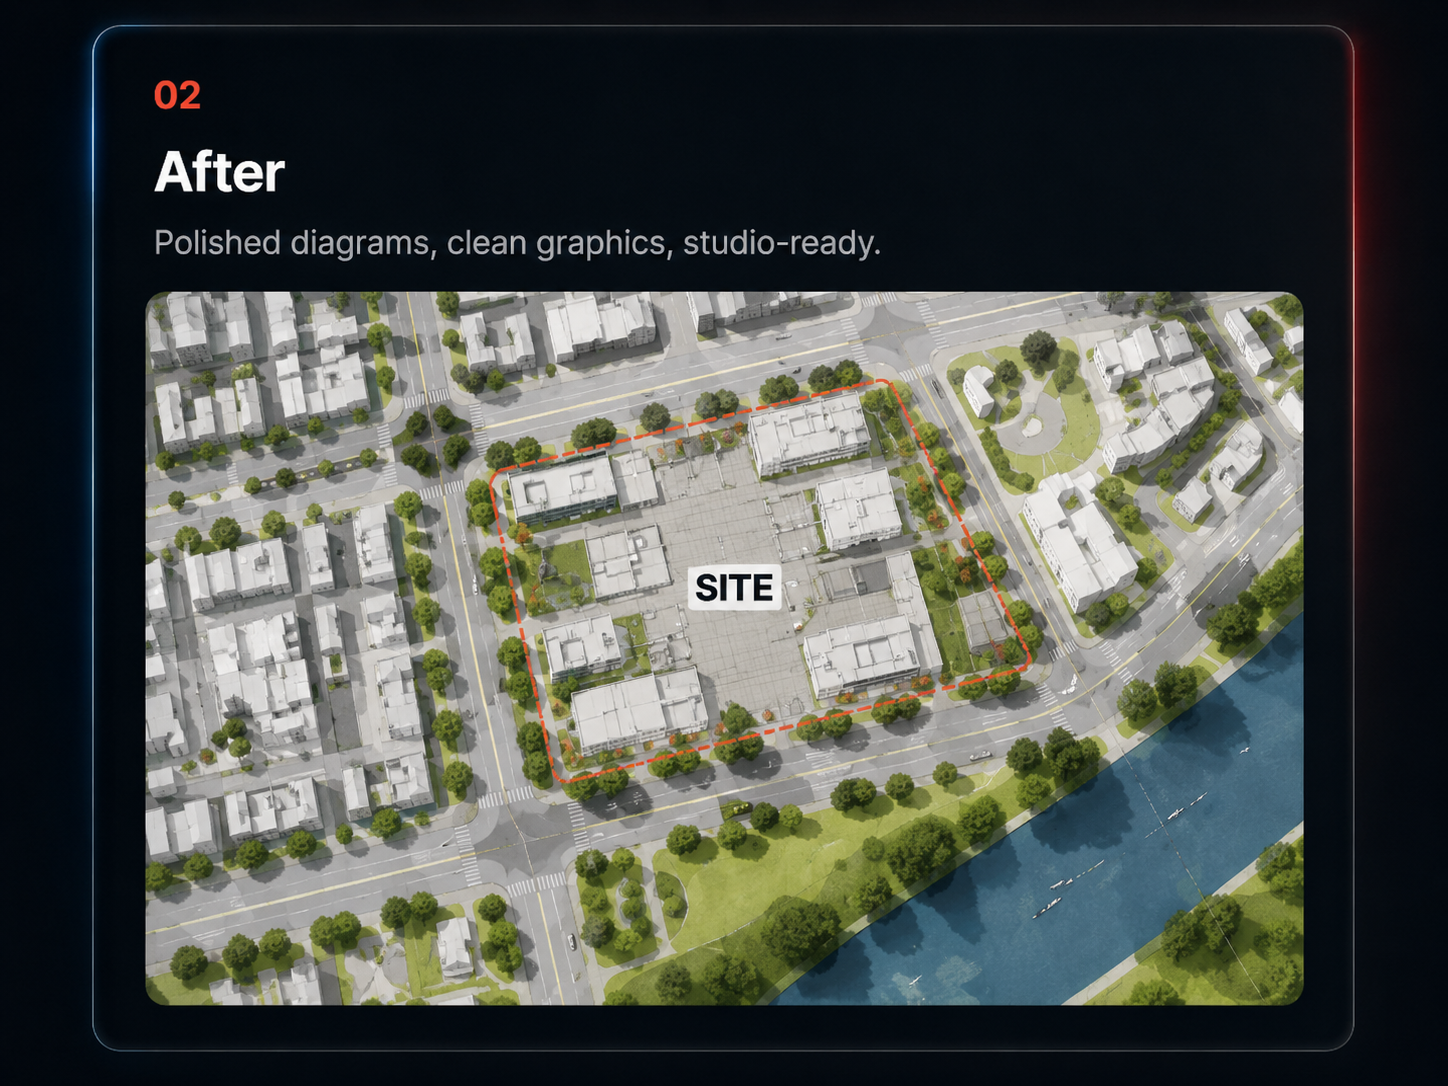
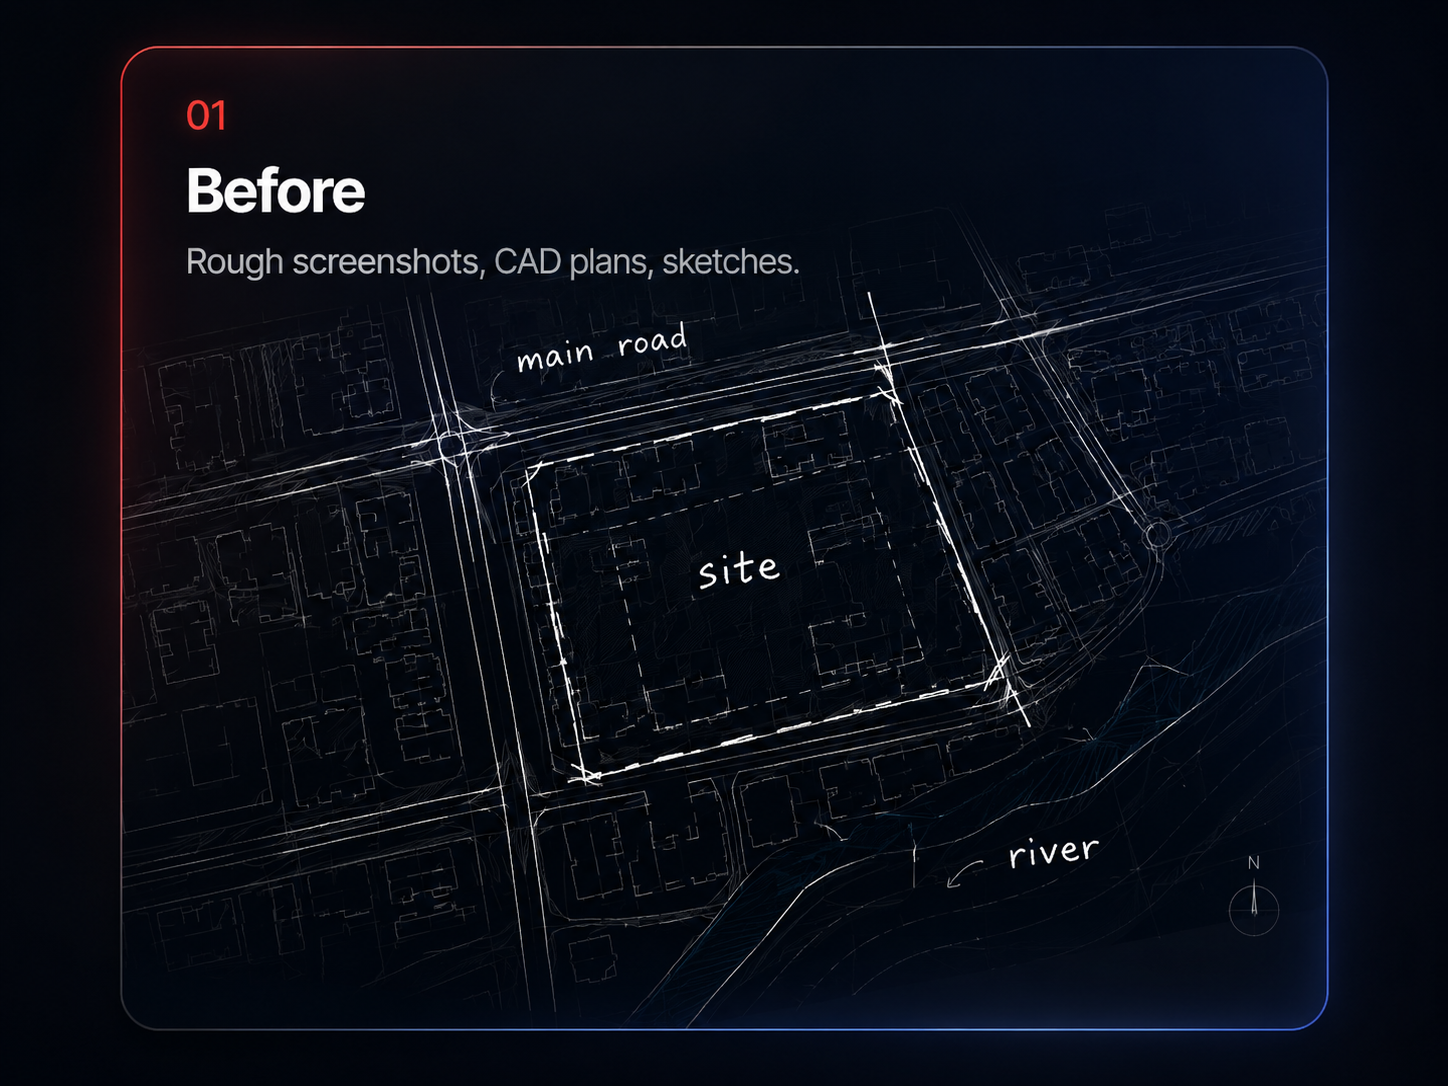
Manual screenshots, traced lines and inconsistent graphic styles slow down early design.
Coordinated diagrams, clean exports and board-ready visuals from the same browser workflow.
Max is the full studio tool line: every diagram stage after the map, built for portfolio and competition output.
Use diagrams directly in Illustrator, portfolio boards and presentation PDFs.
No. EasyMap runs in the browser. Max tools are also HTML tools, so students can use them without heavy software.
Yes. The workflow is made for architecture school diagrams, competition sheets and portfolio layout.
Depending on the tool: PNG, SVG for Illustrator, PDF/print layouts and DXF where supported.
After payment, your Max code unlocks the local browser tools. You can recover the code by email if needed.
No. The main map tool starts the workflow, then Max covers strategy, plan, AXO, flow, bubble, parti, render and layout.
The page presents Pro and Max as one-time lifetime purchases, not monthly subscriptions.
Search an address or click the map. Set a radius from 200 m to 2 km.
Toggle any of the eighteen 2D diagrams, or switch to 3D massing.
Render instantly, then download a report, poster or axonometric PDF.